


Greenspace Access

Introduction
Greenspace is an incredibly broad category that can be most generally understood as places or spaces that contain vegetation. This can include urban parks, rural vegetated land, forests, or even trees that line a road. Such a broad definition is difficult to work with, and many researchers will focus on just a handful of aspects of greenspace, creating a definition for what they mean by greenspace within the context of a particular piece of research. With these shifting definitions of greenspace come shifting definitions of what it means to access said greenspace, and varying ways to measure access.
This becomes relevant to health and the social determinants of health (SDOH) because greenspace is generally recognized as having a positive impact on people’s health for various reasons. These include the fact that vegetation removes carbon dioxide and adds oxygen to the air, can act as barriers against noise and air pollution, reduces heat island effects, and greenspace provides space for physical activity (Gascon et al, 2016). As a result, in the last decade and a half, research investigating potential links between health and greenspace has become increasingly popular in order to understand the mechanisms and thresholds at which greenspace may provide health benefits. This research guide aims to explain and contextualize the most common greenspace access measures being used in health and SDOH research currently, and best practices for incorporating greenspace into health and SDOH research.
Research into greenspace and health began in the late 20th century, first driven primarily by environmental psychology, then by research into physical activity. Technological improvements in the late 90s and early 2000s slowly grew research into links between greenspace and health, as land use and land cover datasets became more accessible. Growth would accelerate into the 2010s as the first validated instrument for “assessing the quality of green space” was published in 2005, and NDVI would be validated as a measure for neighborhood greenspace in 2011 (Giles-Corti et al, 2005; Rhew et al, 2011). The vastly improved technology and recently validated measures allowed health and greenspace access research to become what it is now.
Modern health and greenspace access research is incredibly broad in terms of health impacts being investigated. Beneficial associations have been found relatively consistently between greenspace and mortality, cardiovascular disease morbidity, mental wellbeing, sleep, and physical activity, among others (Yang et al, 2021; Gascon et al, 2016; Gianfredi et al, 2021). Less conclusive evidence has been found for benefits from greenspace access for asthma, cancer, and respiratory disease, among others (Yang et al, 2021). More research needs to be done to understand the particular pathways by which greenspace benefits health.
However, in order to understand the benefits of greenspace, measuring it consistently is crucial. With how quickly the research area expanded, and the breadth of options available to measure greenspace and greenspace access, the methods of this field are far from standardized. This research guide aims to break down the most popular greenspace access measures so that researchers, community members, and public officials can understand and navigate greenspace and health research.
Landscape of Greenspace Access Measures
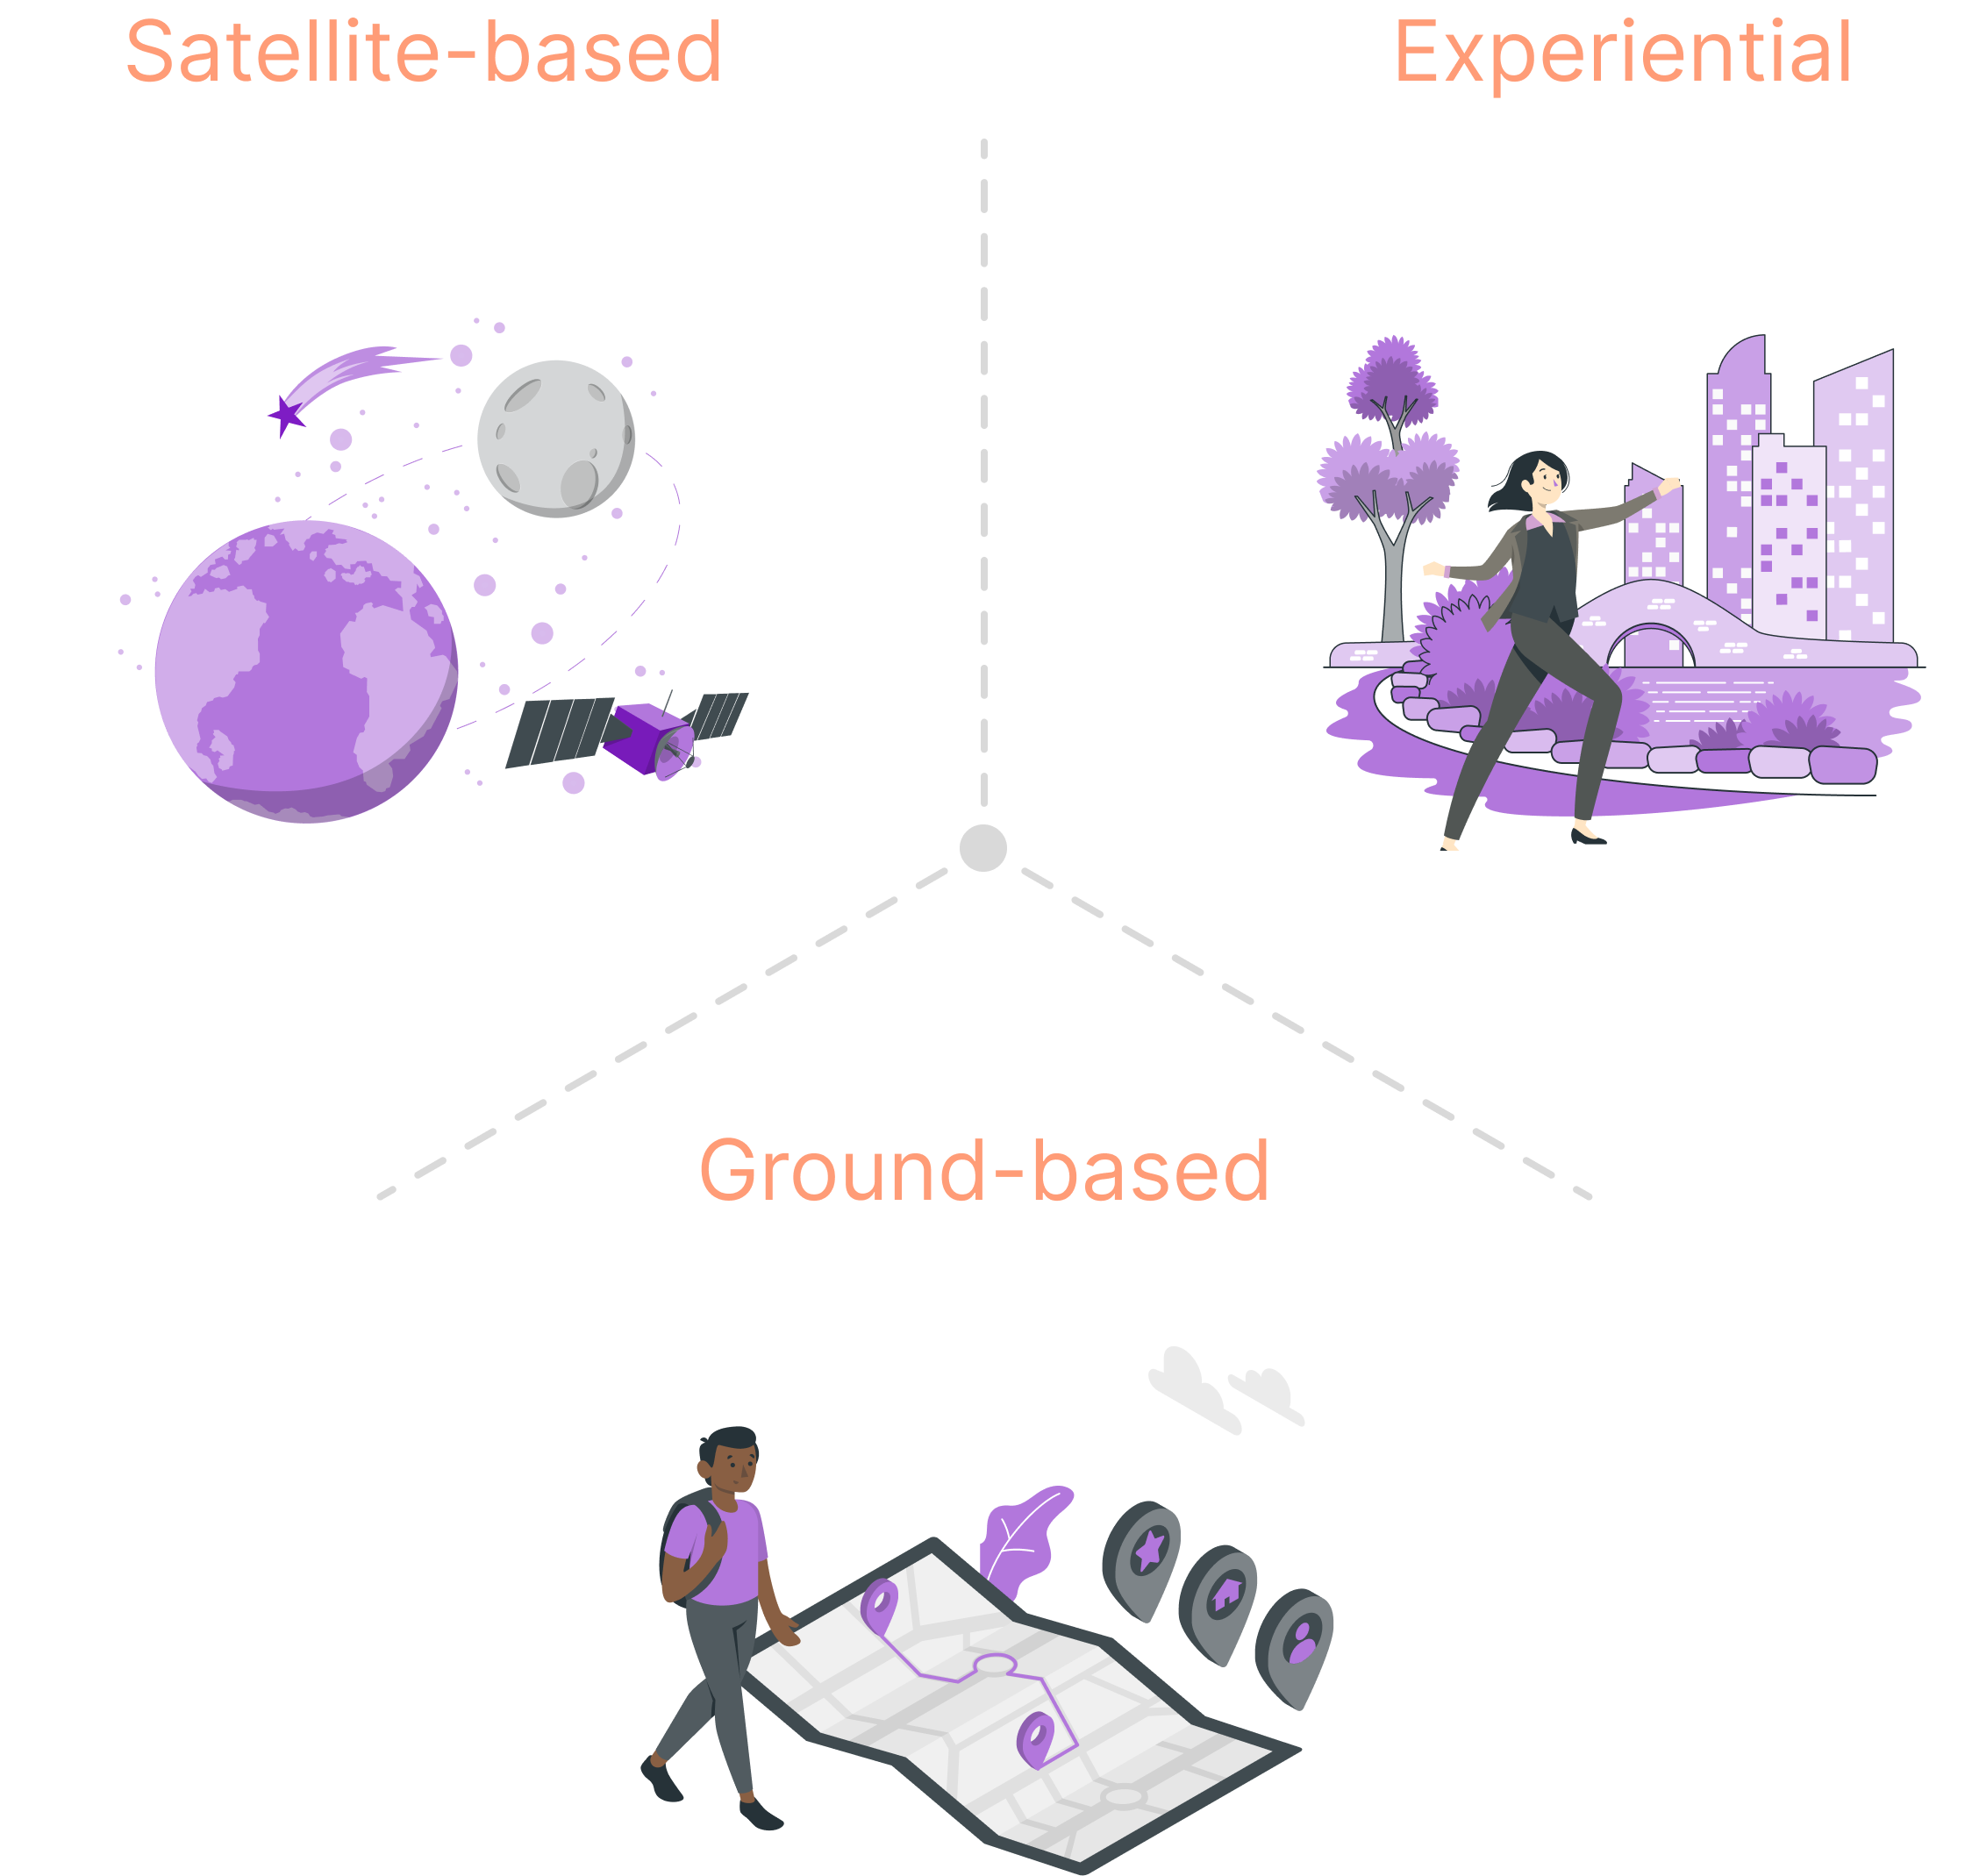
Measurement of greenspaces can vary widely, from complex satellite data, to street views of trees by Google, to surveying people’s experience of the greenspace around them. Before determining the best approach for your research, it can be helpful to get a handle on the potential options. The most popular greenspace measures can be divided into satellite, ground, experiential measures.
Satellite-based measures primarily, if not entirely, are derived from satellite data. A birds-eye view of the data can be useful as an initial assessment. A common satellite-based measure is known as “NDVI.” NDVI is the normalized difference vegetation index, and is a literal measure of greenness derived from satellite imagery. Portions of satellite images are assigned a score between -1 and 1 as an indication of greenness, with -1 being a body of water and 1 being a dense forest. This tends to be the most commonly used variable in research on linking neighborhoods/health to green spaces, because it’s easier to access and use for researchers with limited time, resources, or GIS skills. Other forms of satellite-based measure would include land cover, tree canopy coverage, and more. The following are all examples of satellite-based datasets.
- Morton Arboretum's Community Tree Canopy Summaries
- Google’s Tree Canopy Tool
- Google Earth Engine MODIS Combined 16-Day NDVI
Ground-based measures may incorporate some satellite data, but are primarily derived from data collected by governments or other organizations about the land at a finer scale more relevant to people’s everyday experience. A common ground-based measure is land use, which provides information on what land is used for on a human scale, more likely the order of meters compared to land cover which is often on the scale of acres or hectares. Zoning maps or maps of parks would be types of land use data useful to understanding greenspace access. Aside from land use, street view imagery like that from Google and tree counts, often conducted by municipalities or local non-profits, are other examples of ground-based measures. If satellite-based measures look to answer how “green” a place is, ground-based measures look to understand what constitutes that “greenness”. The following are all examples of ground-based datasets
Experiential measures use data about how people actually experience greenspace, often leaning towards a more qualitative approach and resulting in deeper data about greenspace. Surveys are a common experiential measure, directly asking people about the greenspace around them. These surveys may ask people how much greenspace they feel is accessible to them, how often they use it, how safe they feel while using it, what might change their usage of greenspace, and much more. Audits another experiential measure, where researchers are trained to go into the ‘field’ and evaluate the quality of a greenspace and how they observe people using it. Experiential datasets are typically generated on a case-by-case basis, and may not be publicly available. The following are examples of experiential measures being used in research.
Different Perspectives on Greenspace Measurement
Greenspace access measures can also be divided by if they are material or relational in nature. Material measures are measures of the presence of greenspace, while relational measures are measures of how people perceive their surroundings, such as the quality of greenspace. Often, satellite-based and ground-based measures can be considered material, while experiential measures can be considered relational, but there are exceptions!

Material and relational measures are most frequently referred to as objective and subjective measures respectively in the literature. However, we advocate for adopting material/relational language as it is more descriptive of greenspace measures, it holds less implicit bias, and is not burdened with the hierarchy typically assigned to the objective/subjective dichotomy (Zhang et al, 2022). Further, we argue that material understandings of greenspace access are incomplete without relational understandings of greenspace access.
Not sure where to start with your research? Beginning with material measures you can access and analyze without gathering new data is a good place to start. From there, you can refine your research questions and move on to relational measures to gain a more in-depth understanding of greenspace in your study area.Data for Measuring Greenspace
Table 1 (below) summarizes the most popular greenspace measures being used in health and SDOH literature. Measures are divided into satellite, ground, and experiential measures, and include a description, strengths and limitations, and open source datasets we have identified. Whether measures produce material understandings, relational understandings, or both are identified as part of the strengths and limitations.
Table 1. Summary of popular greenspace measures
| Measure | Description | Strengths | Limitations | Example Open Source Datasets |
|---|---|---|---|---|
| Satellite-Based Measures | ||||
| NDVI (Normalized Difference Vegetation Index) | Measure of greenness on a scale of -1 (water) to 1 (dense forest). Individual pixels of satellite data are assigned a score in this range. Scores are commonly averaged across an areal unit for use. Water may be excluded. | Validated for use at the neighborhood level. Low barrier of entry with open source data, low GIS skills required to compute, low or no cost. | Limited by the quality and availability of satellite imagery. Temporality a significant concern. Requires clear definitions of greenspace for reproducibility (e.g. inclusion or exclusion of water). Only material in nature. | MODIS Combined 16-Day NDVI (Google Earth Engine) |
| Land Cover | Satellite derived data on land type and by extension, vegetation type. | Low barrier of entry with open source data, low GIS skills required to compute, low or no cost. | Limited by the quality and availability of satellite imagery. Tends toward a very coarse scale inappropriate for use at the neighborhood scale. Only material in nature. | USGS Land Cover |
| Tree Canopy Cover | Satellite derived data on the area covered by tree canopy. | Low barrier of entry with open source data, low GIS skills required to compute, low or no cost. Finer scale than land cover and many NDVI datasets. | Limited by the quality and availability of satellite imagery. Temporality a significant concern. Only material in nature. | NLCD Tree Canopy Cover |
| Ground-Based Measures | ||||
| Land Use | Data gathered through a variety of sources including government documentation and satellite data, primarily concerned with how humans use land. Includes products like zoning maps or park maps | Low barrier of entry with open source data, low GIS skills required to compute, low or no cost. At a scale appropriate for use at the neighborhood level. | Potential for representing intention at time of planning but not practical use due to use of planning documents in data generation. Only material in nature. | ParkServe |
| Street View | Data from Google Street View and geotagged images used to calculate a green view index | Fairly low barrier of entry. Better reflects street level greenspace exposure. Potential for incorporation of relational understandings of the data alongside material measures. | Google datasets have a cost to use. Open source datasets have much less even spatial coverage. All datasets have spatial and temporal coverage limitations. | Global Streetscapes |
| Tree Count/Censuses | Raw count of trees typically gathered by local governments and organizations, and may include street view and satellite data. | Low barrier of entry. Better reflects street level greenspace exposure. | Only material in nature. Excludes other vegetation or forms of greenspace. Only material in nature. | NYC Street Tree Census |
| Experiential Measures | ||||
| Self-Report | Data gathered directly from people, typically by survey or interview, on perceptions and experiences of greenspace | Flexible. Directly investigates factors affecting greenspace use. Allows for both material and relational understandings. | Resource intensive. Falls under human subjects research and may be subject to IRB processes. | N/A |
| Audits | Trained auditor conducts a site visit, collecting data on both material and relational aspects of greenspace | Flexible. Opportunities for expert observation. Allows for both material and relational understandings. | Resource intensive. Requires site visit. | N/A |
Calculating Greenspace Access
While using pre-calculated measures such as NDVI by census tract can be accessed for some years, it’s more common for researchers interested in this topic to calculate the measures in the appropriate boundaries of their study area on their own. Some examples of resource measures you could calculate include:
Total number of parks within a buffer
- Create a buffer, join park data to buffered layer and calculate a count of parks by zip code
Proportion of census tacts covered by tree canopy
- Join tree canopy cover to census tract data and calculate the proportion of census tracts intersected by tree canopy
Average NDVI by census tract
- Calculate NDVI scores, join to census tract data and calculate the average NDVI score by census tract
Average qualitative measure of greenspace by participants in a census tract
- Join quantified qualitative measures (ex. Likert scale results) to census tract data and calculate average scores by census tract
In order to work with most of the datasets involved, it is essential to learn the basics of spatial data (data + spatial dimension). Check out Module 4 in our SDOH & Toolkit to kick things off, or review the References at the end of this guide for more beginner basics.
Many of Greenspace measures are not directly measures of greenspace access but of greenspace itself. To make the leap to measuring access to greenspace , these measures must be understood within the context of a distance measurement or their presence within an areal unit. There are two primary forms of areal units that are used for calculating greenspace access measures, buffers and boundaries. We will go more into depth on using both, as well as distance metrics, below.
Buffers
Buffers are used to create uniform catchment areas around a point or boundary. When using buffers in measuring greenspace access, researchers will often present access areas as being within a number of units of a focal point. For example, a researcher may use a buffer of a 500m radius around a park. Here, the researchers are asserting that people within that area can reasonably reach and make use of that park on a regular basis, thus being considered to have ‘access’ to that park. They can then analyze characteristics of the people within that access area. More commonly, researchers may center the buffer on a residence, community center, or other built or social structure. The buffer area of a number of units would then emanate from that focal point, and researchers could then analyze what greenspace is present in this ‘access area’.
Standard Buffer Distances
There is great variation in buffer distances used for greenspace access. A couple of standards have emerged, however, which influences the most common distances. 300m (Euclidean distance) is considered by the European Commission to be a walkable distance (Ekkel & de Vries, 2017). The Australian and American standard is considered to be 400m (Victorian Planning Authority; Sturm & Cohen, 2014). Studies will thus often use these distances as a benchmark, and include smaller or larger buffers based on these distances. Aside from these benchmarks, buffer distances based on 1km or 500m are also common to see.
Tools for Creating Buffers
Buffers can be easily created in QGIS using the Buffer tool. Make sure your data uses a projected coordinate reference system before using this tool. Learn more about why this is the case and how to project your data in Module 4 of the SDOH & Place Toolkit.
Using Data in Buffers
Buffers are often used with a number of different greenspace measures. Using satellite or ground-based measures concerned with greenspace cover (NDVI, land cover, tree canopy cover, land use, street view), researchers can calculate the proportion of a buffer zone that is ‘green’. Alternatively, using ground-based measures (land use, street view, tree count) researchers can calculate the presence or count of an aspect of greenspace within a buffer zone.
Working at Multiple Scales
The modifiable areal unit problem (MAUP) is a problem in which different results emerge from an analysis depending on the scale being used (Collins et al, 2020; Liu et al, 2022). For example, people will have different access to greenspace within 100m, 300m, and 500m of their home. It is a problem under-addressed in research using spatially aggregated data, but there are solutions, including conducting a sensitivity analysis or using a multi-scalar approach (Zhou et al, 2021; Collins et al, 2020). Considering the lack of standardization in distance thresholds in greenspace access research, we recommend using a multi-scalar approach. This can be achieved through the use of progressive buffers (for example buffers of 100m, 300m, 500m, 1km). This then not only counteracts the MAUP, but by using multiple buffers, makes it more likely that researchers include the same thresholds in their research.
Boundaries
Boundaries are areal units that, unlike buffers, do not radiate out from a specific point. While researchers can create their own boundaries if they wish, it is much more common to use pre-existing political or statistical boundaries, such as census boundaries. Census tracts are considered to be optimal for health research, although zip codes are frequently used due to the privacy requirements of HIPAA.
Boundaries are very useful for implementation when using preexisting health datasets for a few reasons. First, preexisting health datasets often have an indication of areal unit, such as zip code or FIPS code, associated with each case. Second, boundary datasets can often be found through government data portals. This makes them easy to access and easy to use with health data. From there, researchers can analyze greenspace access in relation to this spatialized health data.
Tools for Working with Boundaries
In QGIS, Join tools (e.g. Join Attributes by Location) will be useful in joining spatialized health data with greenspace measures.
Using Data with Boundaries
Similarly to buffers, satellite- and ground-based measures can be used to calculate the proportion of a boundary unit that is ‘green’, and ground-based measures can be used to calculate the presence or count of an aspect of greenspace within a boundary unit. In addition to these, boundaries also allow for easy calculation of per capita measures of greenspace. This offers a more relational perspective for measures typically thought of as producing only material data.
Working at Multiple Scales
Also much like buffers, making use of multiple boundary levels can be used to circumvent the MAUP. A strong study may therefore conduct analysis at both the block group and census tract levels. Again, this also serves to fill the multi-scalar research gap that exists in the health and greenspace research area.
Distance
Rather than analyzing greenspace access within a defined area through boundaries or buffers, researchers may also choose to analyze distances to greenspace. There are two primary distance measures researchers use: Euclidean distance and network distance.
Euclidean Distance
Euclidean distance is the straight-line distance between two points. It is sometimes referred to as “as the crow flies”. This may be used to measure distance between a residence and a park, for example. In QGIS, Distance Matrix, Distance to Nearest Hub, or Proximity (Raster Distance) can be used to measure Euclidean distance between points in the same vector layer, points in different vectors layers, or points in raster data, respectively.
Network Distance
Network distance is the shortest distance between two points by using a network of roads or paths. In QGIS, this can be measured using the Network Analysis tools. Both Shortest Path and Service Area can be calculated. Shortest Path would be used to calculate network distance between two specific points, a park and a residence, for example. Service Area would be used to define an area where all points are within a specified network distance of a chosen point, for example an area where all points are within 1km of a particular park. As with buffers, be sure your data uses a projected coordinate reference system before using these tools.
These greenspace measures and implementation practices do not represent the full range of greenspace access measures. Rather, they are the most common and most approachable options for those without significant knowledge of GIS and spatial analysis, and provide a range of options suitable for the majority of research concerned with greenspace and SDOH.
Best Practices
With all of this information about how greenspace access can be measured for SDOH research, there are a number of best practices we recommend in actually implementing these measures. First, define greenspace for your study. This can take a number of forms. When using NDVI, this will look like specifying whether or not water was excluded from analysis. When using the presence of ‘parks’, this looks like specifying how a park was defined, for example by size or by government designation. Anyone reading your research should be able to replicate what qualifies as greenspace in your study.
Also towards the goal of replicability, make sure your methodology is detailed and data sources are clearly cited. Including what greenspace measures you used, how they were implemented, and even what programs and packages you used for your analysis ensure the highest level of replicability possible. Clearly citing data sources is particularly important as well, as any open source datasets can be used to replicate your research or further that research.
Additionally, as previously discussed, the use of multiple scales is best practice. This works to resolve both analytical issues such as the MAUP, and standardization issues across the field. A lack of direct engagement by researchers working in greenspace and health with health disparities and SDOH frameworks has also been documented (Besser et al, 2023). Work in the SDOH space should explicitly engage with these frameworks, and the structures of oppression that create inequities in greenspace access. Relatedly, there is a research gap in the greenspace and health area between high income countries and low and middle income countries (Besser et al, 2023; Collins et al, 2020).
A number of reviews have used the presence of objective (material) measures of greenspace as an indication of study quality, or limited reviews to only include studies using objective measures (Lachowycz & Jones, 2011; Gascon et al, 2016; Twohig-Bennett & Jones, 2018; de Keijzer et al, 2020; Collins et al, 2020; Mueller et al, 2022). We discourage this practice as it reproduces biases among researchers (and the public) that studies with a relational focus are less rigorous and lower quality. On the contrary, recent scholarship has found that relational measures may be better predictors of greenspace usage than material measures, and are linked to more positive relationships between greenspace and health outcomes (Liu et al, 2024; Zhang et al, 2022; Houlden et al, 2018). Material and relational measures simply measure different aspects of greenspace access, and what measures researchers use should be carefully chosen to align with the research question being tested.
All of these recommended best practices are in the interest of creating replicable, well-rounded studies that contribute to the understanding of the interactions between greenspace access and health at large. As you grow more familiar and comfortable working with greenspace data and calculating greenspace access measures, you will be able to use more of the types of data introduced in this guide, and implement more best practices.
About the Author

References
- Besser, L. M., Jimenez, M. P., Reimer, C. J., Meyer, O. L., Mitsova, D., George, K. M., Adkins-Jackson, P. B., & Galvin, J. E. (2023). Diversity of Studies on Neighborhood Greenspace and Brain Health by Racialized/Ethnic Group and Geographic Region: A Rapid Review. International Journal of Environmental Research and Public Health, 20(9), 5666. https://doi.org/10.3390/ijerph20095666
- Collins, R. M., Spake, R., Brown, K. A., Ogutu, B. O., Smith, D., & Eigenbrod, F. (2020). A systematic map of research exploring the effect of greenspace on mental health. Landscape and Urban Planning, 201, 103823. https://doi.org/10.1016/j.landurbplan.2020.103823
- de Keijzer, C., Bauwelinck, M., & Dadvand, P. (2020). Long-Term Exposure to Residential Greenspace and Healthy Ageing: a Systematic Review. Current Environmental Health Reports, 7(1), 65–88. https://doi.org/10.1007/s40572-020-00264-7
- Ekkel, E. D., & de Vries, S. (2017). Nearby green space and human health: Evaluating accessibility metrics. Landscape and Urban Planning, 157, 214–220. https://doi.org/10.1016/j.landurbplan.2016.06.008
- Gascon, M., Triguero-Mas, M., Martínez, D., Dadvand, P., Rojas-Rueda, D., Plasència, A., & Nieuwenhuijsen, M. J. (2016). Residential green spaces and mortality: A systematic review. Environment International, 86, 60–67. https://doi.org/10.1016/j.envint.2015.10.013
- Gianfredi, V., Buffoli, M., Rebecchi, A., Croci, R., Oradini-Alacreu, A., Stirparo, G., Marino, A., Odone, A., Capolongo, S., & Signorelli, C. (2021). Association between Urban Greenspace and Health: A Systematic Review of Literature. International Journal of Environmental Research and Public Health, 18(10), 5137. https://doi.org/10.3390/ijerph18105137
- Giles-Corti, B., Broomhall, M. H., Knuiman, M., Collins, C., Douglas, K., Ng, K., Lange, A., & Donovan, R. J. (2005). Increasing walking: How important is distance to, attractiveness, and size of public open space? American Journal of Preventive Medicine, 28(2, Supplement 2), 169–176. https://doi.org/10.1016/j.amepre.2004.10.018
- Houlden, V., Weich, S., Albuquerque, J. P. de, Jarvis, S., & Rees, K. (2018). The relationship between greenspace and the mental wellbeing of adults: A systematic review. PLOS ONE, 13(9), e0203000. https://doi.org/10.1371/journal.pone.0203000
- Lachowycz, K., & Jones, A. P. (2011). Greenspace and obesity: a systematic review of the evidence. Obesity Reviews, 12(5). https://doi.org/10.1111/j.1467-789X.2010.00827.x
- Liu, D., Kwan, M.-P., Yang, Z., & Kan, Z. (2024). Comparing subjective and objective greenspace accessibility: Implications for real greenspace usage among adults. Urban Forestry & Urban Greening, 96, 128335. https://doi.org/10.1016/j.ufug.2024.128335
- Liu, X.-X., Ma, X.-L., Huang, W.-Z., Luo, Y.-N., He, C.-J., Zhong, X.-M., Dadvand, P., Browning, M. H. E. M., Li, L., Zou, X.-G., Dong, G.-H., & Yang, B.-Y. (2022). Green space and cardiovascular disease: A systematic review with meta-analysis. Environmental Pollution, 301, 118990. https://doi.org/10.1016/j.envpol.2022.118990
- Mueller, W., Milner, J., Loh, M., Vardoulakis, S., & Wilkinson, P. (2022). Exposure to urban greenspace and pathways to respiratory health: An exploratory systematic review. Science of The Total Environment, 829, 154447. https://doi.org/10.1016/j.scitotenv.2022.154447
- Rhew, I. C., Stoep, A. V., Kearney, A., Smith, N. L., & Dunbar, M. D. (2011). Validation of the Normalized Difference Vegetation Index as a measure of neighborhood greenness. Annals of Epidemiology, 21(12), 946–952. https://doi.org/10.1016/j.annepidem.2011.09.001
- Sturm, R., & Cohen, D. (2014). Proximity to Urban Parks and Mental Health. The Journal of Mental Health Policy and Economics, 17(1), 19–24. https://www.ncbi.nlm.nih.gov/pmc/articles/PMC4049158/
- Twohig-Bennett, C., & Jones, A. (2018). The health benefits of the great outdoors: A systematic review and meta-analysis of greenspace exposure and health outcomes. Environmental Research, 166, 628–637. https://doi.org/10.1016/j.envres.2018.06.030
- Victorian Planning Authority. (2019). Public Open Space - 400m Walkable Catchment - Victorian Government Data Directory. https://discover.data.vic.gov.au/dataset/public-open-space-400m-walkable-catchment
- Yang, B.-Y., Zhao, T., Hu, L.-X., Browning, M. H. E. M., Heinrich, J., Dharmage, S. C., Jalaludin, B., Knibbs, L. D., Liu, X.-X., Luo, Y.-N., James, P., Li, S., Huang, W.-Z., Chen, G., Zeng, X.-W., Hu, L.-W., Yu, Y., & Dong, G.-H. (2021). Greenspace and human health: An umbrella review. The Innovation, 2(4), 100164. https://doi.org/10.1016/j.xinn.2021.100164
- Zhang, Y., Zhang, Y., van Dijk, T., & Yang, Y. (2022). Green place rather than green space as a health determinant: A 20-year scoping review. Environmental Research, 214, 113812. https://doi.org/10.1016/j.envres.2022.113812
- Zhou, Y., von Lengerke, T., & Dreier, M. (2021). Comparing different data sources by examining the associations between surrounding greenspace and children’s weight status. International Journal of Health Geographics, 20(1), 24. https://doi.org/10.1186/s12942-021-00278-w


