


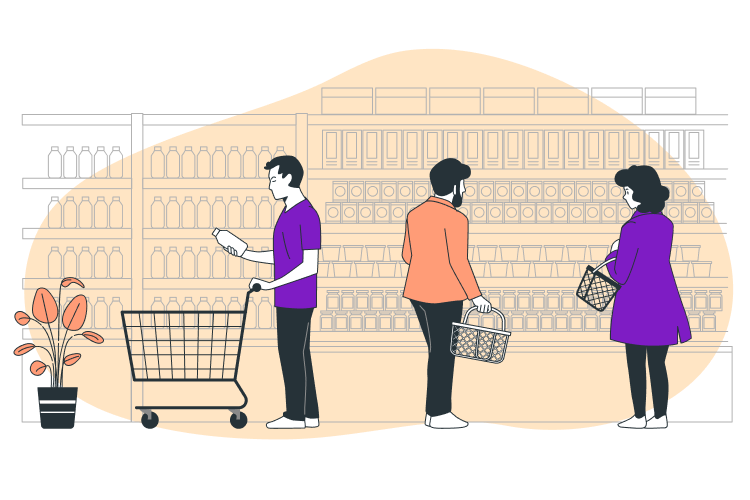
Measuring Food Access on a Neighborhood Level
Background
Food access is the measure of how easy it is for a person or community to get to and afford food that is for sale.1 Communities with less access to healthy foods experience more obesity,2 poorer physical3 and mental health,4 and worse outcomes in school.5 This article will discuss how to measure how difficult it is for people to get to where they buy food. It will also cover how various kinds of food are easier or harder to get. Accessibility is a multi-dimensional topic, including affordability, accommodation, acceptability, spatial availability, and more.6 In this study guide, we’ll focus on measuring the availability and acceptability dimensions of food access.
Dimensions of Food Access
Availability
The most basic measure of food access in a neighborhood is to count the number of businesses that sell any kind of food. This approach is termed the “container method,” as the total number of resources are “binned” by the unit of analysis (e.g. total number of groceries per census tract).7 The next level is to measure the distance between where people live and the nearest store. This distance-based approach can be useful when considering how persons can move across administrative boundaries to access markets.8 However, people don’t travel in straight lines since they have to follow roads. They also decide their routes based on timing, public transportation, and their physical surroundings.9 A researcher has to take all this into account when considering how to measure how people get to stores.
In measuring the distance between a household and a food source location, it is useful to consider the experience of the people who do the shopping. Route of travel is more important than distance, as it takes into account the mode of travel (e.g. driving, walking, public transit). This extends not only to measuring the length of streets, but also considering public transportation availability and schedules.11 People also experience access differences based on the quality of walking routes9 and the level of public and personal safety along them.12 Additionally, researchers must acknowledge that people begin shopping journeys not only from their homes but from all of the places that they frequent in their daily lives.14
Low-income households face even more restrictions on time15 and movement.16 They often lack car transport and are dependent on walking or public transport. They also face more subtle barriers, such as social discomfort in upscale retailers.17 Age, disability, caregiving responsibilities, and strict work schedules are other factors that decrease the resources that an individual or household can access and change the routes that they are able to travel. On the other hand, the rapid expansion of meal and grocery delivery services changes food use and purchase and the importance of distance.18
Acceptability
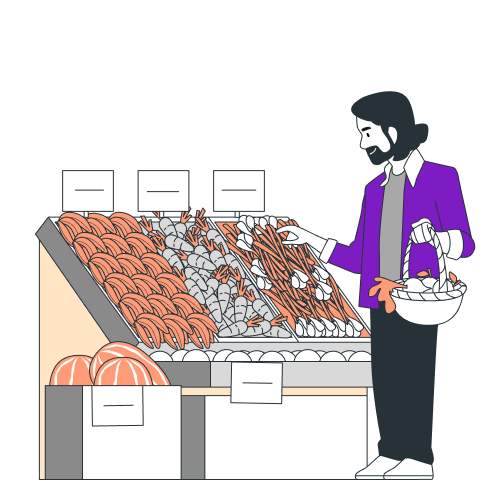
Another dimension of measuring food access takes into account food quality. Some foods are high in sugar, fat, and sodium, while others are much more nutrient-dense. People also need a wide variety of foods in their diets.10 Acceptability is the measure of accessibility that includes whether the food available in a place is healthy or unhealthy, freshness and safety, and whether it aligns with individual and cultural preferences and restrictions. Food access measures that focus on access to unhealthy foods, for example, may identify “food swamps”.13
Food quality for the purposes of access research can be divided into the presence of healthy foods and the absence or lack of exposure to unhealthy foods. This presents a thorny issue of definition and categorization. The priority of nutrition programming for the United States10 among other nations is to increase the consumption of fresh fruits and vegetables among households and to minimize the consumption of Energy Dense, Nutrient Poor (EDNP) foods, including but not limited to fast food,14 sugar-sweetened beverages, and packaged snacks and confections. Different categories of retail establishments tend to offer different ratios of produce to EDNPs. Large supermarkets tend to have the most fruits and vegetables, whereas convenience stores sell mostly packaged food with a preponderance of snacks and sweets. Depending on the cultural context, an area may also have more specialty food shops such as butchers or bakers, or open-air markets.
Affordability
The comparative affordability of different kinds of food and the effect this has on health is beyond the scope of this guide. Affordability is relevant to local accessibility when some foods may be for sale in an area, but at a price premium that they do not command elsewhere. Fresh foods like fruits and vegetables, and to a lesser extent dairy, eggs, fish, and meat, are most likely to show this price increase.34 People must then choose between paying extra, traveling further to get lower prices, or forgoing these foods.
Data Collection
Using multiple kinds of data in research on food accessibility will make the results more meaningful. Qualitative data allows for direct numerical comparison, statistical analysis, and comparison over time. Regulatory bodies and grant funding institutions may also require the provision of specific qualitative data. Recording complementary qualitative, descriptive data in addition is likely to add context and nuance. It can help to show the deep and complex roots behind stubborn problems. Qualitative data will also help to determine whether the results from one study or measurement are generalizable to another study or region.
There is also a tradeoff in collecting data between expense and accuracy. For example, large national and regional datasets of stores collected by governments or retail associations may be free to access but are infrequently updated and often are unrepresentative of the range of food sources currently available to the local population.20 A research team may have to call or visit retail locations in person to verify if they are in business and what their hours are.
Census Data
In the United States, the Census Bureau makes aggregate data available from all of the surveys it collects. Basic population data is available down to the level of each individual zip code or census tract. Employment, SNAP enrollment, and poverty rates are also available, as are a wide variety of social factors.33 These allow you to measure the correlation between any of these socioeconomic factors and the differences in the food environments between neighborhoods.
Focus Groups
Focus groups are a great source of qualitative data on the specific barriers to healthy food and cooking choices that residents of an area face. They can be drawn from all the residents or from subgroups of concern. The elderly, single mothers, students, and SNAP recipients are some of the groups most likely to lack food access and may provide the best data.2 Focus groups should be asked open-ended questions. These can be about how group members shop for food, where they get fruits and vegetables, and what barriers they face to cooking at home.21
Survey Tools
Data is gathered from large groups of people using surveys. The questions in the survey must be carefully designed and tested to make sure that the answers are reliable. The wording and order of the questions can make a big difference in the data. Table 1 lists validated survey questionnaires commonly used in food access research.
Data Sets
Lists of food retail establishments can be acquired from government departments or from commercial data aggregators. This information may be a starting point, but it will need to be checked before use due to errors and infrequent updates. Commercial data is also costly and is not necessarily structured in a way that is most useful for food access research.
Composite Indices
Institutions and individual scholars have created indices that combine location, food quality, and survey data into numerical scores for neighborhoods or other small geographic areas. Each index will use a different set of data inputs and method of calculation, so results will vary between them. The USDA Food Access Research Atlas has done the data collection and calculations for the broadest area. It would be most useful as an input. The Healthy Food Availability Index and the Place Based Food Insecurity and Vulnerability Index would be more useful as methods to follow to make data you have collected easier to interpret and communicate.
Table 1. Research Resources
| Data Collection Type | Datasets |
|---|---|
| Survey Tools | NEMS-SS 22,23 STARS Atlantic PATH Diet Quality Score |
| Composite Indices | USDA Food Access Research Atlas 3,11,24 Healthy Food Availability Index 20 Place Based Food Insecurity and Vulnerability Index25 |
| Proprietary Data Sets Food Retail Data sets | Locatus Commercial Dataset14 National Establishment Time-Series Database by Walls & Associates Open Street Maps23 WIC store lists USDA Benefit Redemption Division (SNAP data)11 State Departments of Agriculture2 Dunn & Bradstreet Business Establishment Data26 Nielsen TD Linx27 |
\*\*Data Processing Tools\*\*
Geographic Information Systems
The most common tool for spatial analysis at the moment are Geographic Information Systems (GIS), which are computer programs that collect, analyze and reference data that have a geographic component28. Once the locations and characteristics of food sources are input into a GIS program, you will then be able to calculate measures of access, distance, and centrality for the sources themselves and also for the residential areas located nearby. While basic programs calculate straight-line or street-route distances between residential locations and stores or other resources, improved processes allow the accessibility calculations to more nearly match the experiences of people who walk or use public transportation.
More advanced access metrics can take into account supply and demand, as well as additional measures impacting access. For example, Ng et al9 created the Aggregated Accessibility Index, which prioritizes routes that require least effort rather than those that take the least distance in geocomputational modelling. They did so by taking into account various measures of route quality. This is in some ways a question of transportation measurement and methodology, but transportation is one of the major barriers to accessing health food for many communities.11,29
Nexus Analysis
Nexus Analysis is a process for the analysis of qualitative data first developed by Scollon and Scollon.30 It provides a structure for adding social dimensions of availability on top of distance and time. This process works with notes from observational data and transcripts from interviews or focus groups. It is a way of organizing observations of the patterns in the way people behave. This allows a researcher to discuss social forces in a way that has more rigor than a story or a hunch, since someone else could repeat the same process with the same data. Carter17 used this approach to demonstrate that a farmer’s market was able to bring down structural and cultural barriers to buying fresh fruits and vegetables beyond making them closer and less expensive for the residents of a specific neighborhood.
Machine Learning Algorithms
Machine learning can extend spatial and non-spatial analyses to process large quantities of data, extract new insights and trends, and identify interesting patterns in food accessibility. Algorithms can be trained to categorize food and assess the balance across an entire menu of foods that are high or low in fat/salt/sugar32. When multiplied by the many restaurants and fast food outlets in a neighborhood, this allows for a level of analysis that would require a prohibitive level of labor if humans were to do the scoring and categorization. This tool can allow a geographical area to be surveyed more frequently at lower cost. Wider and more frequent surveillance will allow for the effects of programs and policy changes to be evaluated.
Conclusion
The understanding of the different components of food accessibility and the development for valid techniques for measuring these components is changing quickly. This article has summarized several dimensions of accessibility and ways of approaching their measurement. The question you are asking of your data will determine which approach you choose to take. Measuring different dimensions of access also allows greater clarity about the drivers of human behavior and the effectiveness of public health policy with respect to food and nutrition. As the body of evidence grows about the importance of diet to many fields of health and wellbeing, students, researchers, and people working in government and nonprofit sectors can all benefit from rigorous methods of analyzing food environments.
About the Author

References
- Anon. n.d. “What Is Food Security? There Are Four Dimensions.” World Bank. Retrieved February 13, 2025 ( https://www.worldbank.org/en/topic/agriculture/brief/food-security-update/what-is-food-security).
- Zenk, Shannon N., Graciela Mentz, Amy J. Schulz, Vicki Johnson-Lawrence, and Causandra R. Gaines. 2017. “Longitudinal Associations Between Observed and Perceived Neighborhood Food Availability and Body Mass Index in a Multiethnic Urban Sample.” Health Education & Behavior 44(1):41–51. doi: 10.1177/1090198116644150.
- Howell, Carrie R., Carmen L. Wilson, Yutaka Yasui, Deo K. Srivastava, Wei Lu, Kari L. Bjornard, Matthew J. Ehrhardt, Tara M. Brinkman, Wassim Chemaitilly, Jason R. Hodges, Jennifer Q. Lanctot, Leslie L. Robison, Melissa M. Hudson, and Kirsten K. Ness. 2020. “Neighborhood Effect and Obesity in Adult Survivors of Pediatric Cancer: A Report from the St. Jude Lifetime Cohort Study.” International Journal of Cancer 147(2):338–49. doi: 10.1002/ijc.32725.
- Hoerster, Katherine D., Sarah Wilson, Karin M. Nelson, Gayle E. Reiber, and Robin M. Masheb. 2016. “Diet Quality Is Associated with Mental Health, Social Support, and Neighborhood Factors among Veterans.” Eating Behaviors 23:168–73. doi: 10.1016/j.eatbeh.2016.10.003.
- Wang, Yan, and Maureen Black. 2019. “Child Food Insecurity and Neighborhood Food Environment in Relation to Academic Performance and Behavior Problems Among a National Sample of Kindergarten Children (OR02-04-19).” Current Developments in Nutrition 3:nzz051.OR02-04-19. doi: 10.1093/cdn/nzz051.OR02-04-19.
- Penchansky, Roy, and J. William Thomas. 1981. “The Concept of Access: Definition and Relationship to Consumer Satisfaction.” Medical Care 19(2):127–40. doi: 10.1097/00005650-198102000-00001.
- Talen, E., and L. Anselin. 1998. “Assessing Spatial Equity: An Evaluation of Measures of Accessibility to Public Playgrounds.” Environment and Planning A: Economy and Space 30(4):595–613. doi: 10.1068/a300595.
- Widener, Michael J., Sara S. Metcalf, and Yaneer Bar-Yam. 2011. “Dynamic Urban Food Environments a Temporal Analysis of Access to Healthy Foods.” American Journal of Preventive Medicine 41(4):439–41. doi: 10.1016/j.amepre.2011.06.034.
- Ng, Ka Yiu, Andy Hong, Christopher D. Higgins, Michael J. Widener, and Keumseok Koh. 2024. “Beyond Distance: Measuring Spatial Accessibility to Healthy Food for Older Adults in Hong Kong Using a 3D Least-Effort Method.” Applied Geography 169:103336. doi: 10.1016/j.apgeog.2024.103336.
- U.S. Department of Agriculture and U.S. Department of Health and Human Services. 2020. Dietary Guidelines for Americans, 2020-2025. 9.
- DeJohn, Amber D., Michael J. Widener, and Jerry Shannon. 2023. “Transit Access to Subsidized Food Stores in the U.S. Midwest.” The Professional Geographer 75(1):76–89. doi: 10.1080/00330124.2022.2103720.
- Mui, Yeeli, Ellis Ballard, Eli Lopatin, Rachel L. J. Thornton, Keshia M. Pollack Porter, and Joel Gittelsohn. 2019. “A Community-Based System Dynamics Approach Suggests Solutions for Improving Healthy Food Access in a Low-Income Urban Environment” edited by K. Latham-Mintus. PLOS ONE 14(5):e0216985. doi: 10.1371/journal.pone.0216985.
- Ares, Gastón, Sergio Turra, Luciana Bonilla, María Costa, Sofía Verdier, Gerónimo Brunet, Florencia Alcaire, María Rosa Curutchet, and Leticia Vidal. 2024. “WEIRD and Non-Consensual Food Deserts and Swamps: A Scoping Review of Operational Definitions.” Health & Place 89:103315. doi: 10.1016/j.healthplace.2024.103315.
- Mackenbach, Joreintje D., Michael J. Widener, Emilie Van Der Gaag, and Maria Gm. Pinho. 2023. “Survey-Derived Activity Space-Based Exposures to Fast Food Outlets and Their Cross-Sectional Associations with Use of Fast Food Outlets, Diet Quality and BMI.” Health & Place 79:102966. doi: 10.1016/j.healthplace.2023.102966.
- Smith, Lindsey G., Michael J. Widener, Bochu Liu, Steven Farber, Leia M. Minaker, Zachary Patterson, Kristian Larsen, and Jason Gilliland. 2022. “Comparing Household and Individual Measures of Access through a Food Environment Lens: What Household Food Opportunities Are Missed When Measuring Access to Food Retail at the Individual Level?” Annals of the American Association of Geographers 112(2):542–62. doi: 10.1080/24694452.2021.1930513.
- Liu, Bochu, Michael J. Widener, Lindsey G. Smith, Steven Farber, Dionne Gesink, Leia M. Minaker, Zachary Patterson, Kristian Larsen, and Jason Gilliland. 2023. “Time-Geographic Project of Household Food Provision: Conceptualization and a Pilot Case Study.” Annals of the American Association of Geographers 113(3):675–99. doi: 10.1080/24694452.2022.2134088.
- Carter, Andrew. 2023. “Mapping the Influence: A Nexus Analysis Approach to Addressing Food Access.” Health Communication 38(2):228–37. doi: 10.1080/10410236.2021.1945196.
- Vedovato, Gabriela M., Shahmir H. Ali, Caitlin M. Lowery, and Angela C. B. Trude. 2022. “Giving Families a Voice for Equitable Healthy Food Access in the Wake of Online Grocery Shopping.” Nutrients 14(20):4377. doi: 10.3390/nu14204377.
- Díez, Julia, Alba Cebrecos, Alba Rapela, Luisa N. Borrell, Usama Bilal, and Manuel Franco. 2019. “Socioeconomic Inequalities in the Retail Food Environment around Schools in a Southern European Context.” Nutrients 11(7):1511. doi: 10.3390/nu11071511.
- Hutton, Nicole S., George McLeod, Thomas R. Allen, Christopher Davis, Alexandra Garnand, Heather Richter, Prachi P. Chavan, Leslie Hoglund, Jill Comess, Matthew Herman, Brian Martin, and Cynthia Romero. 2022. “Participatory Mapping to Address Neighborhood Level Data Deficiencies for Food Security Assessment in Southeastern Virginia, USA.” International Journal of Health Geographics 21(1):17. doi: 10.1186/s12942-022-00314-3.
- Farmer, Nicole, Ralph Tuason, Kimberly R. Middleton, Assumpta Ude, Gladys Tataw-Ayuketah, Sharon Flynn, Narjis Kazmi, Alyssa Baginski, Valerie Mitchell, Tiffany M. Powell-Wiley, and Gwenyth R. Wallen. 2024. “Assessing Acceptability: The Role of Understanding Participant, Neighborhood, and Community Contextual Factors in Designing a Community-Tailored Cooking Intervention.” Nutrients 16(3):463. doi: 10.3390/nu16030463.
- Blackman, Kacie C. A., Sabrina Smiley, Wenonah Valentine, Lisa Chaudhari, Patty Kwan, Wyconda Cotton-Curtis, Carrie Saetermoe, and Thomas Chan. 2022. “The Earliest Food Deserts: Availability of Infant and Follow-on Formula, and Lactation Support Products among Stores in Black and Non-Hispanic White Zip Codes in Los Angeles County.” Maternal and Child Health Journal 26(4):863–71. doi: 10.1007/s10995-021-03196-2.
- Quezada, Carolina Rojas, Michael J. Widener, Juan Antonio Carrasco, Fernando Meneses, and Tiara Rodríguez. 2023. “Accessibility Indicators to Fresh Food: A Quantitative Insight from Concepción, Chile.” The Professional Geographer 75(3):345–60. doi: 10.1080/00330124.2022.2094423.
- Jiang, Qianxia, Bethany Forseth, Lauren Fitzpatrick, Helena H. Laroche, Sarah Hampl, Ann M. Davis, Chelsea Steel, and Jordan Carlson. 2023. “Prospective Associations of Neighborhood Healthy Food Access and Walkability with Weight Status in a Regional Pediatric Health System.” International Journal of Behavioral Nutrition and Physical Activity 20(1):113. doi: 10.1186/s12966-023-01514-1.
- Meenar, Mahbubur R. 2017. “Using Participatory and Mixed-Methods Approaches in GIS to Develop a Place-Based Food Insecurity and Vulnerability Index.” Environment and Planning A: Economy and Space 49(5):1181–1205. doi: 10.1177/0308518X16686352.
- Berger, Nicolas, Tanya K. Kaufman, Michael D. M. Bader, Andrew G. Rundle, Stephen J. Mooney, Kathryn M. Neckerman, and Gina S. Lovasi. 2019. “Disparities in Trajectories of Changes in the Unhealthy Food Environment in New York City: A Latent Class Growth Analysis, 1990–2010.” Social Science & Medicine 234:112362. doi: 10.1016/j.socscimed.2019.112362.
- Lamichhane, Archana P., Joshua L. Warren, Marc Peterson, Pasquale Rummo, and Penny Gordon-Larsen. 2015. “Spatial-Temporal Modeling of Neighborhood Sociodemographic Characteristics and Food Stores.” American Journal of Epidemiology 181(2):137–50. doi: 10.1093/aje/kwu250.
- USGS. 2023. “What Is a Geographic Information System (GIS)? | U.S. Geological Survey.” Retrieved February 3, 2025 (https://www.usgs.gov/faqs/what-a-geographic-information-system-gis).
- Farber, Steven, Melinda Z. Morang, and Michael J. Widener. 2014. “Temporal Variability in Transit-Based Accessibility to Supermarkets.” Applied Geography 53:149–59. doi: 10.1016/j.apgeog.2014.06.012.
- Scollon, Ronald, and Suzanne B. K. Scollon. 2004. Nexus Analysis: Discourse and the Emerging Internet. London ; New York: Routledge.
- Velmurugan, Giajenthiran. 2024. “Advocating for Nexus Analysis: Integrating Micro and Macro Perspectives in Problem-Based Learning Research.” Journal of Problem Based Learning in Higher Education 12(2):69–77. doi: 10.54337/ojs.jpblhe.v12i2.9023.
- Norriss, Dru, Rose Crossin, Angela Curl, Susan Bidwell, Elinor Clark, Tessa Pocock, Ryan Gage, and Christina McKerchar. 2022. “Food Outlet Access and the Healthiness of Food Available ‘On-Demand’ via Meal Delivery Apps in New Zealand.” Nutrients 14(20):4228. doi: 10.3390/nu14204228.
- Anon. n.d. “Census Bureau Tables.” Retrieved August 15, 2024 (https://data.census.gov/table?g=860XX00US01105,01108).
- Cohen, Nevin. 2019. “SNAP at the Community Scale: How Neighborhood Characteristics Affect Participation and Food Access.” American Journal of Public Health 109(12):1646–51. doi: 10.2105/AJPH.2019.305363.


