


Wildfire Smoke Exposure and Health Equity in Northern California
App Motivation
This dashboard was developed to create an accessible tool for community members, students, and researchers to better understand the wildfire smoke burden in their communities. In addition to visualizing smoke exposure, the application highlights how exposure intersects with social vulnerability and population health outcomes across Northern California.
The goal of the project is to support learning, awareness, and equity-oriented analysis by showing not only where smoke exposure is highest, but also which communities may need additional support before, during, and after hazardous wildfire smoke events.
About the Application
This multi-tab data dashboard allows users to explore cumulative wildfire smoke exposure from 2006–2020 at both the census tract and county level across Northern California.
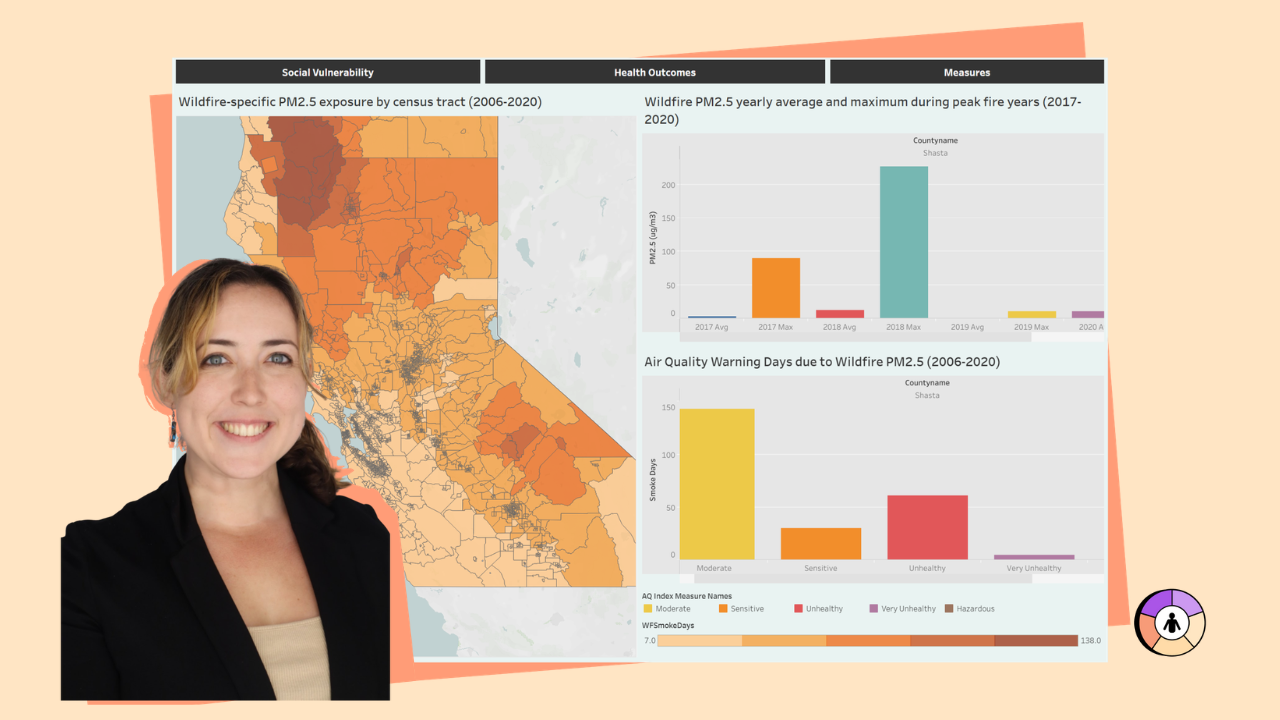
The dashboard visualizes the number of days each census tract experienced poor air quality due specifically to wildfire-attributed PM2.5, categorized according to EPA air quality risk levels, including:
- Moderate
- Unhealthy for Sensitive Groups
- Unhealthy
- Very Unhealthy
- Hazardous
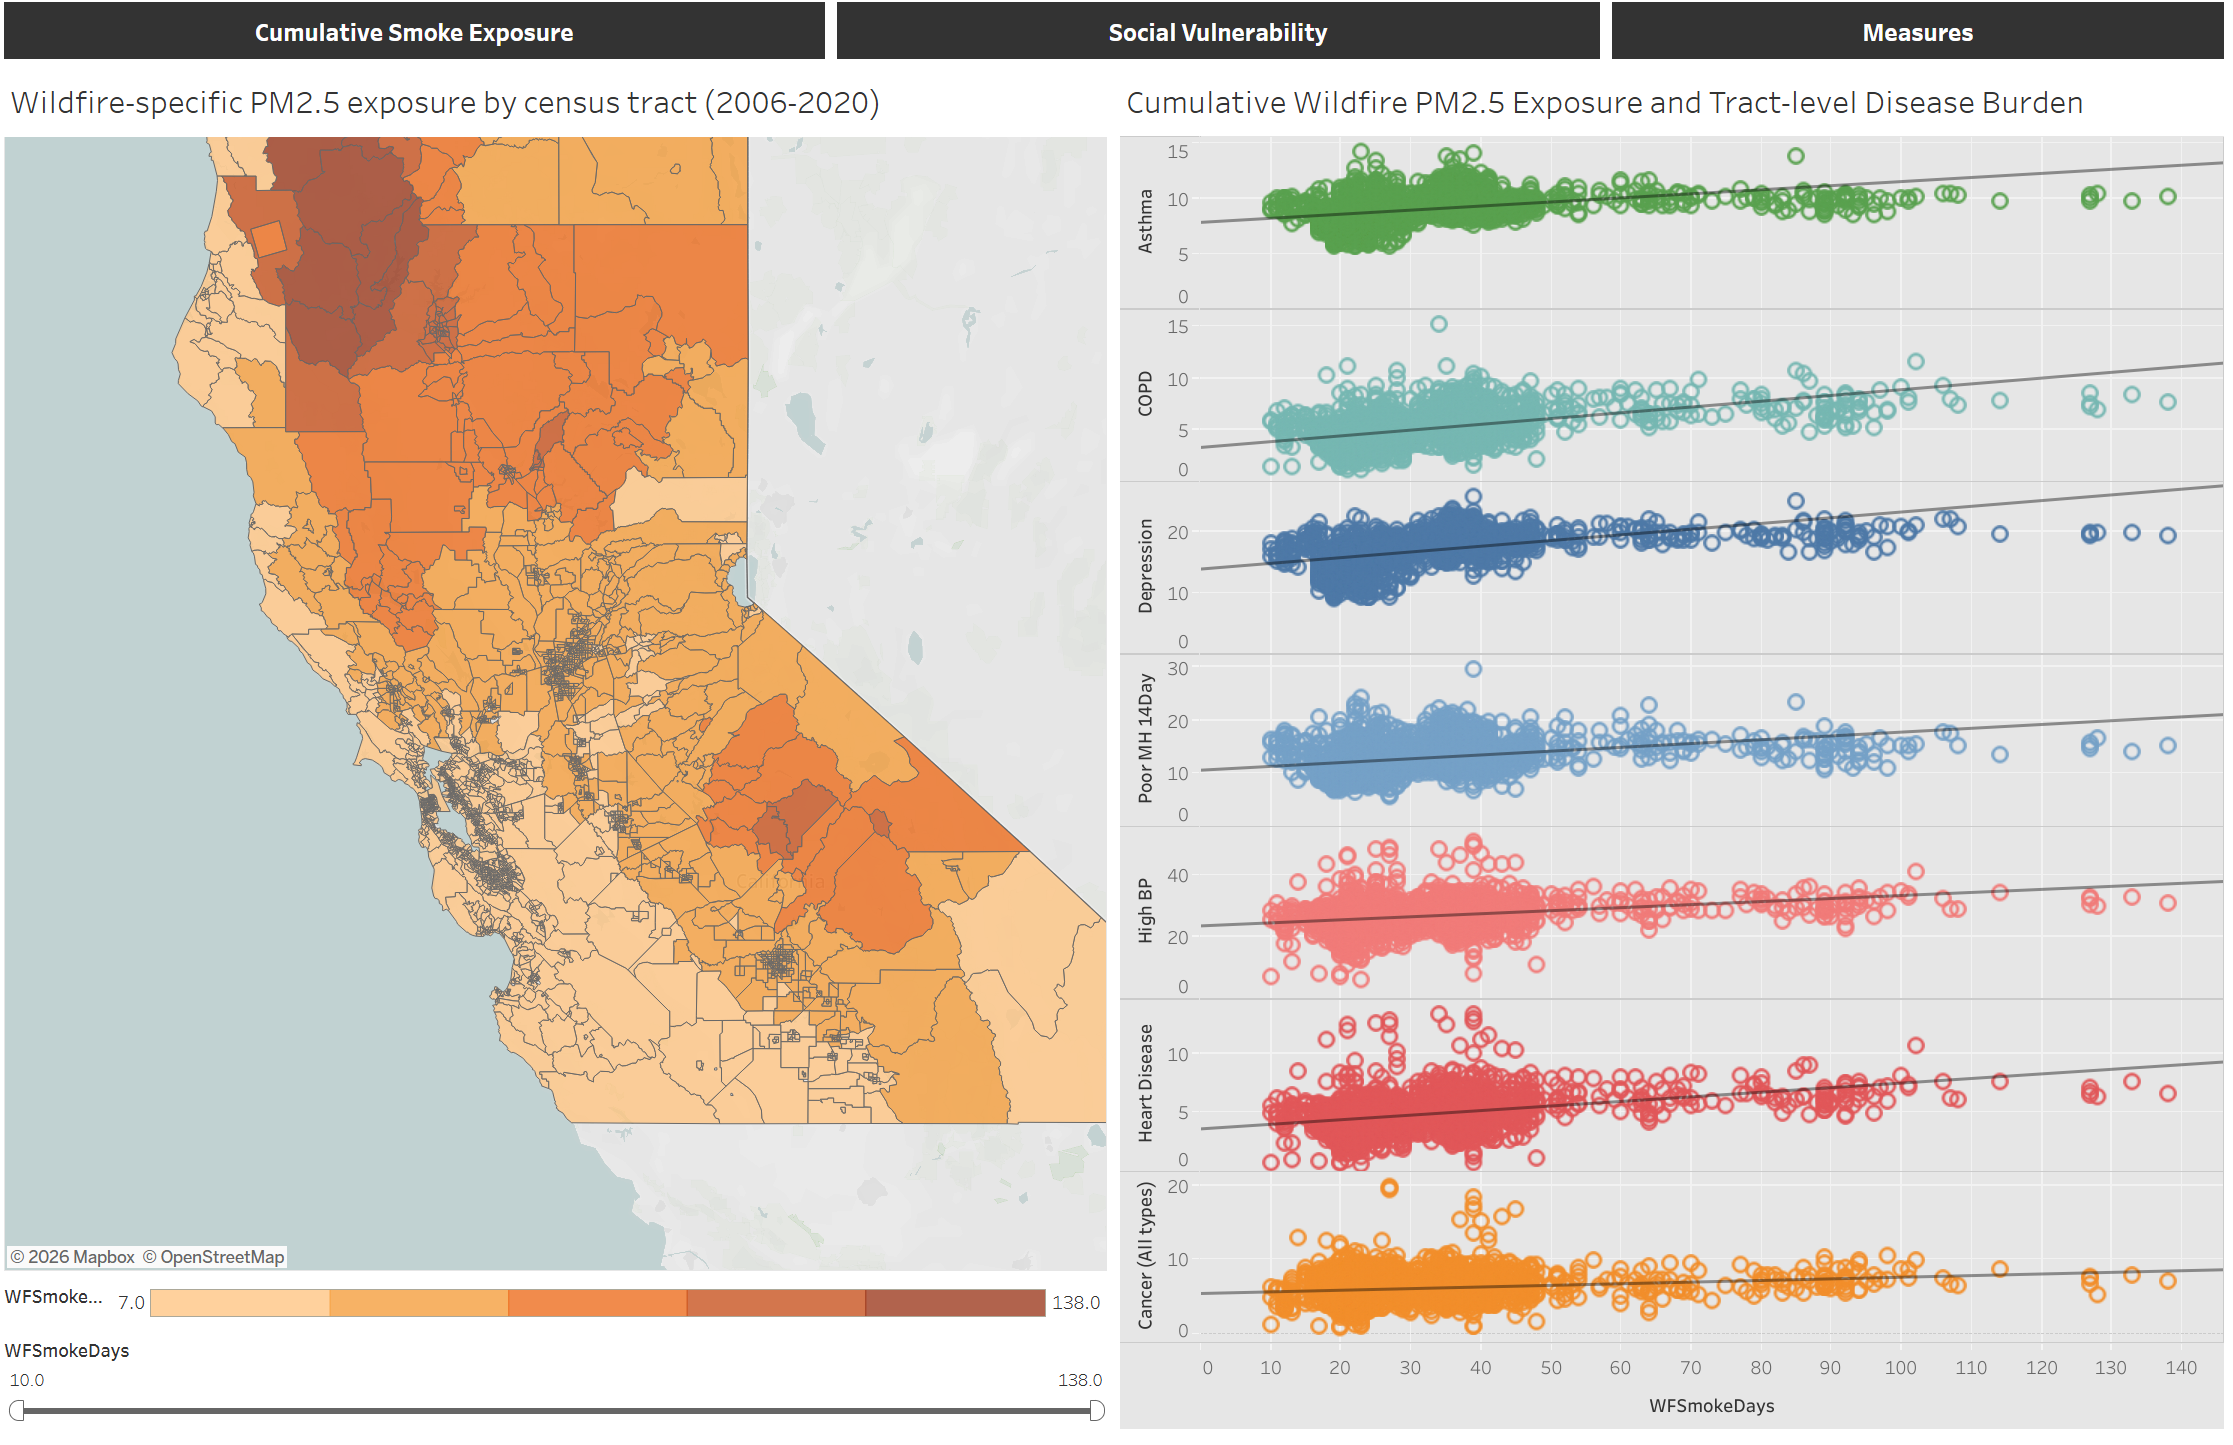
In addition to exposure data, the dashboard integrates social vulnerability indicators and population health data from the CDC PLACES dataset, allowing users to examine how cumulative smoke exposure relates to disease prevalence at the census tract level.
Target Users
This application was designed for:
- General public and community members
- Public health students
- Researchers interested in environmental health and equity
The interface is designed to support exploration by both technical and non-technical audiences.
Features
Cumulative Smoke Exposure Tab
Users can explore how many days a census tract has experienced wildfire-attributed poor air quality and visualize peak exposure during major wildfire years (2017–2020).
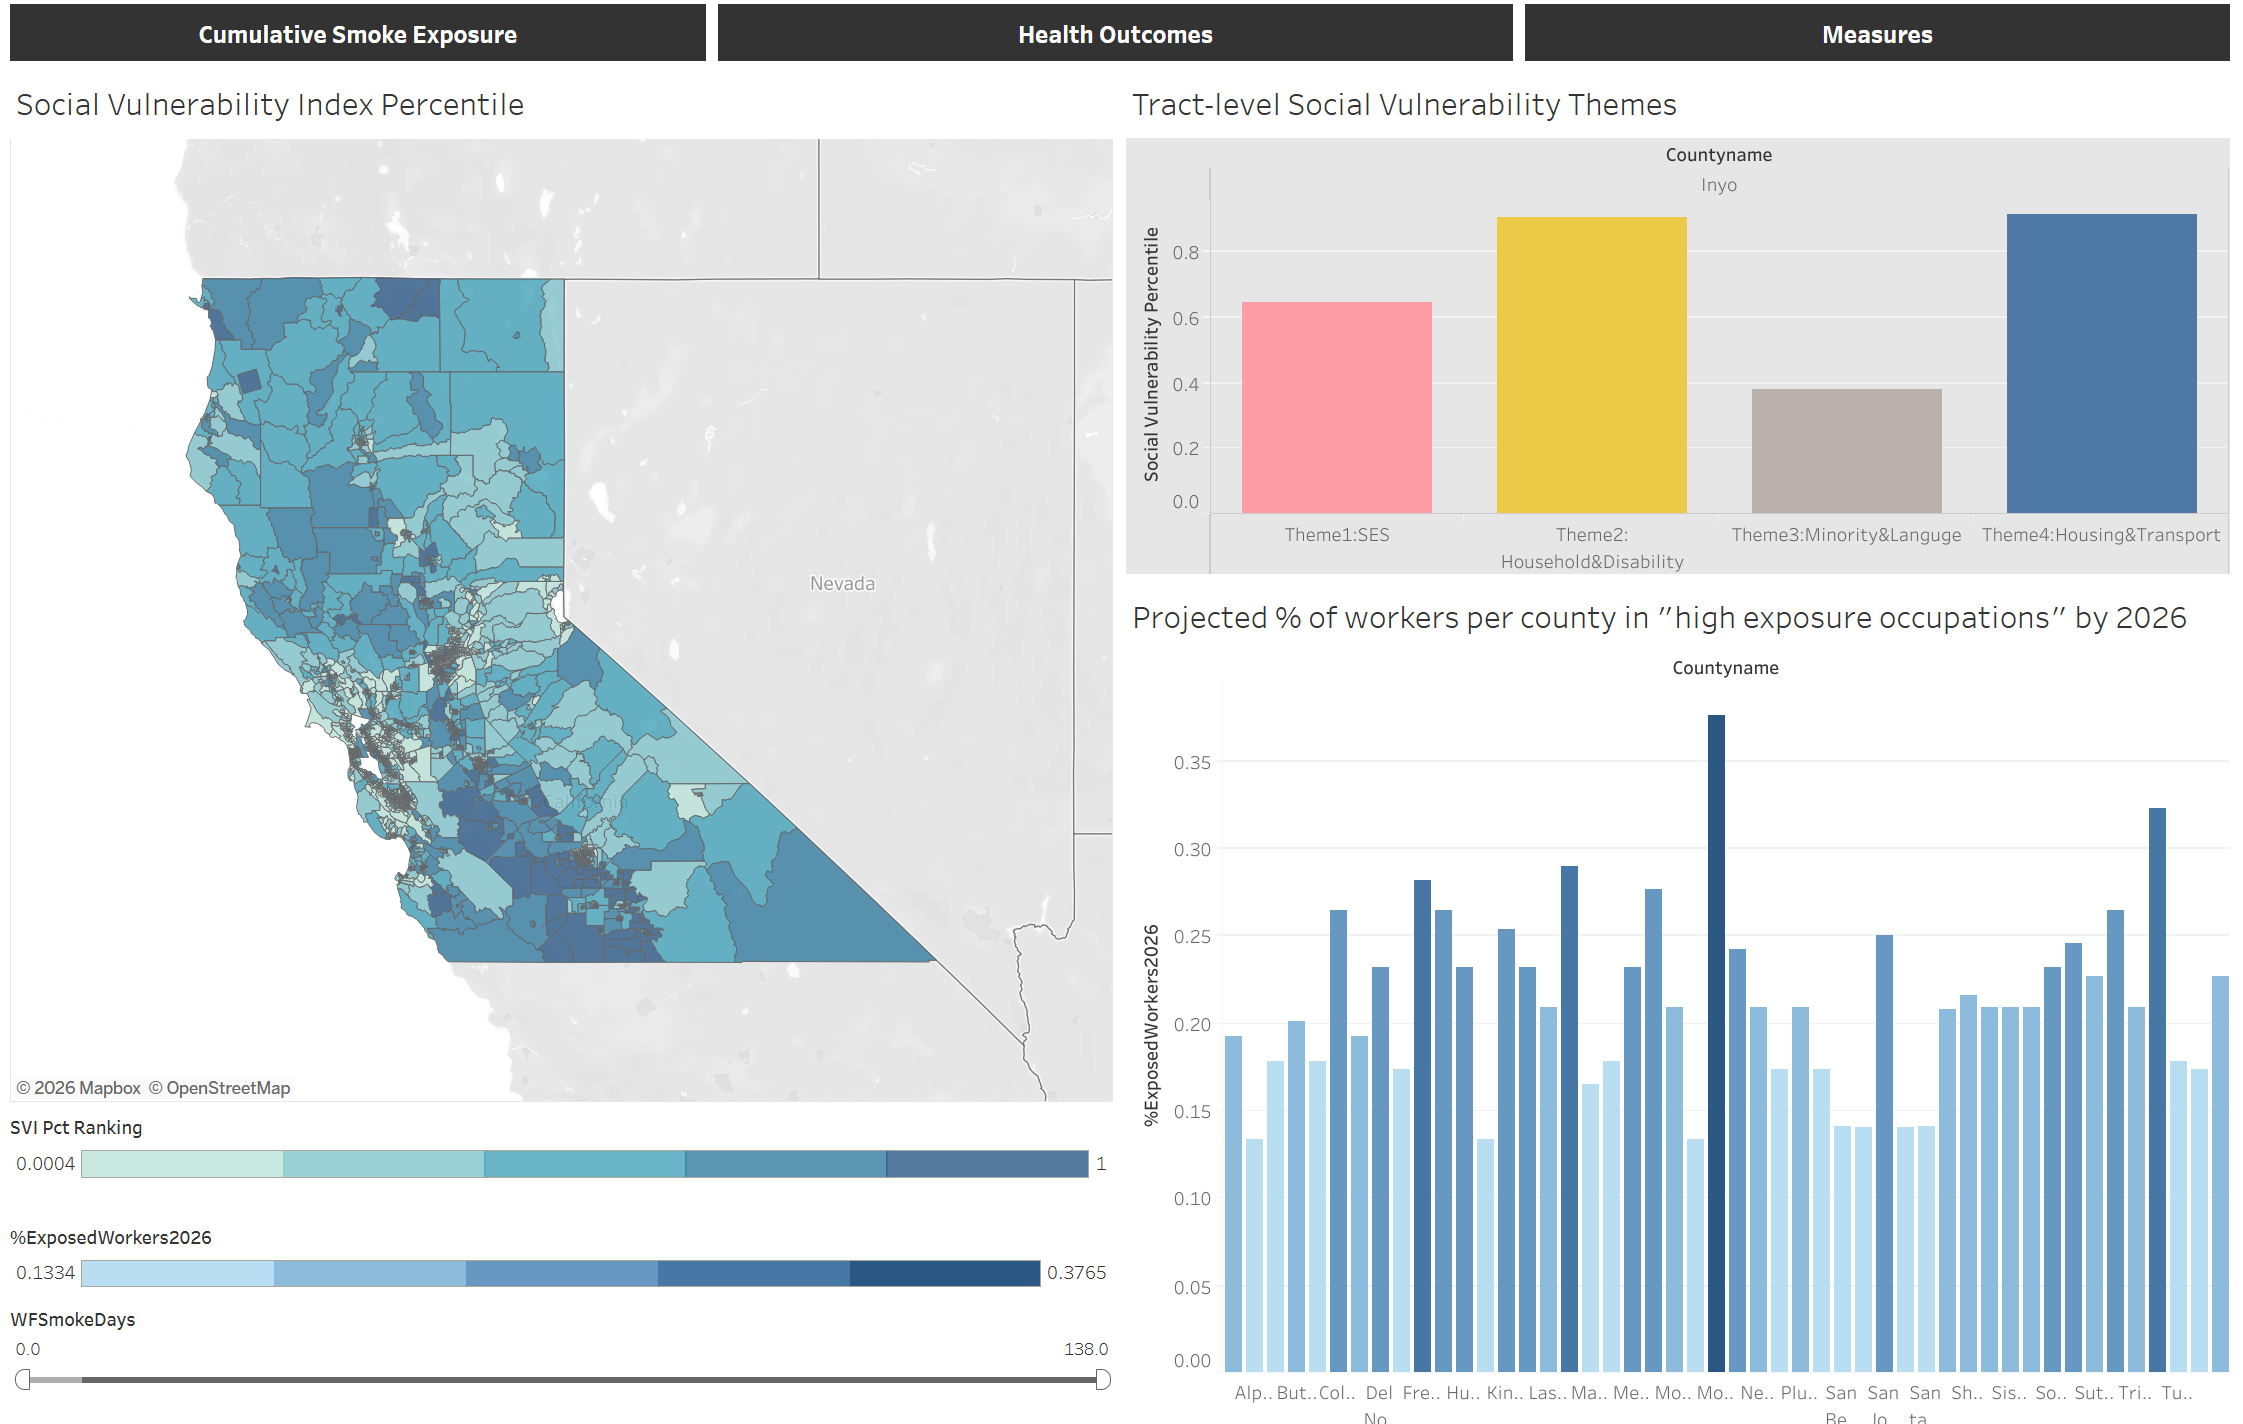
Social Vulnerability Tab
Highlights counties with higher proportions of workers in high-exposure occupations, such as outdoor workers or those in facilities with limited air filtration, identifying communities that may be particularly vulnerable to smoke exposure.
Health Data Integration
Incorporates CDC PLACES health data, enabling users to examine associations between cumulative smoke exposure and disease prevalence at the census tract level.
Web App
public.tableau.com/shared/254T6N6M5?:display_count=n&:origin=viz_share_link
Tech Stack
Tableau Data Dashboard


